Introducing lndmon: Dockerized Lightning Network Monitoring
by Valentine Wallace
Today we’re excited to announce the first alpha release of
lndmon: a drop-in, dockerized
monitoring solution for lnd. As the network has grown over the past year,
we’ve noticed gaps in its observability and the need for an easy-to-use tool for
routing node operators to manage their nodes. This year, lack of such a suitable
tool caused certain problems in the peer-to-peer network to remain undiscovered
until they became harmful. lndmon (which works with lnd 0.7 and beyond,
thanks in part to the new
feature of exporting gRPC
performance data) helps prevent problems by enabling users to monitor trends and
take preventative
action. For example, a routing node operator may want to be notified if multiple
channels are closed in rapid succession or if their peer connections show signs
of instability.
Besides preventing network trouble, lndmon is a flexible monitoring tool for
routing node operators and other users who want to track how their channels
change over time. Users can also monitor network-wide trends, such as growth in
the number of channels and where the best routing fee rates can be found.
Architecture

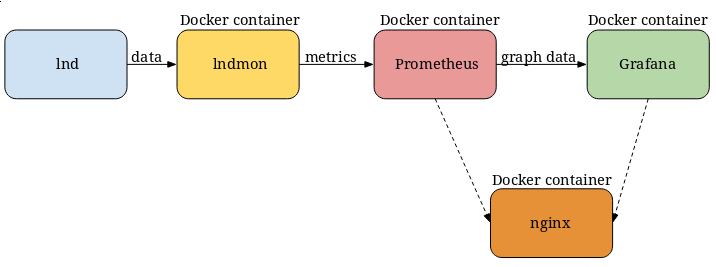
lndmon is built with Prometheus and
Grafana. Prometheus scrapes metrics from lndmon, and
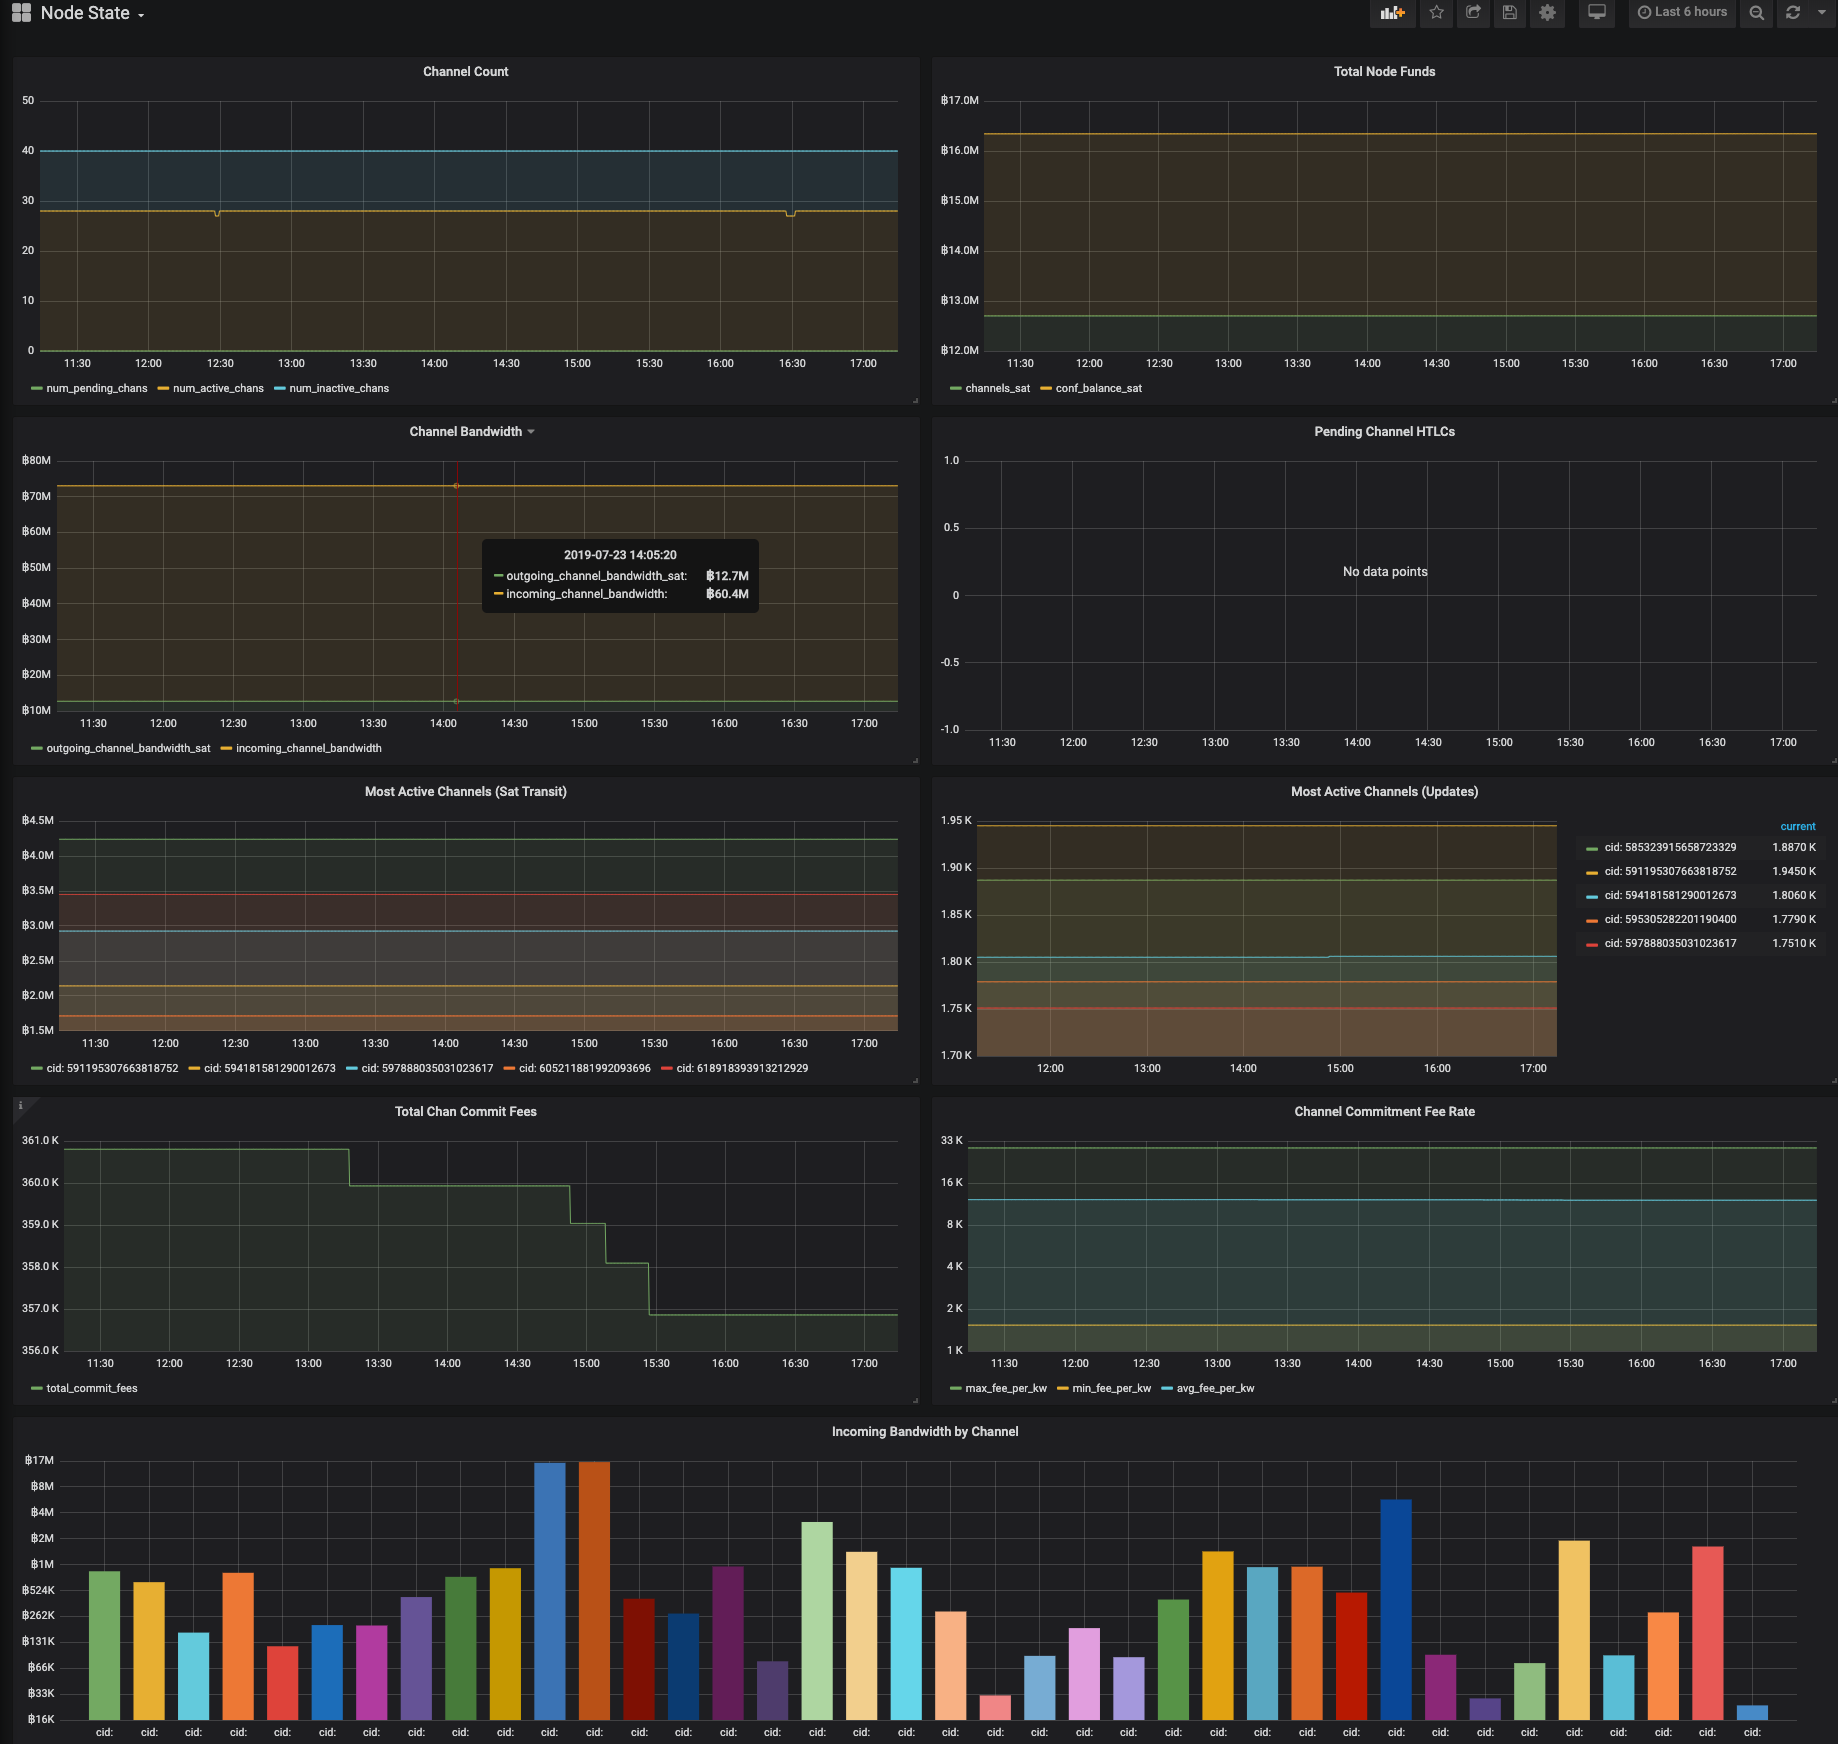
Grafana presents the data in eye-catching graphs. lndmon comes with a set of
basic graphs out-of-the-box, but users are encouraged to add their own
customized graphs to match their specific needs.
Nginx is an optional component of lndmon which adds the ability for users to
access their dashboards remotely over TLS.
A major advantage of Prometheus is its query
language. Let’s
go through an example. One might ask, “what is the average number of bytes
received from my 5 most bandwidth-hogging peers?”
First, we want to get the number of bytes received from the top 5 peers:
topk(5, lnd_peer_recv_byte)
Next, we simply average them:
avg(topk(5, lnd_peer_recv_byte))
Prometheus makes it easy to get creative when extracting information from your
node.
Design Goals
A primary design goal of lndmon is easy setup. Running lndmon locally is as
simple as filling in the path to your lnd directory and running
docker-compose up. All data is persisted automatically in docker volumes. If
you want to access your dashboard remotely over TLS, you just have to fill in a
few more fields and run another docker-compose command. TLS certs will
automatically renew when they expire. Everything is intended to be as simple to
use as possible.
Here’s an example dashboard:

Licensing
Another nifty aspect of lndmon is that it’s open source with an MIT
license. The current graphs are relatively
basic and there’s ample opportunity for
external contributors to improve upon them. Alternatively, users are free to
fork the project for their own purposes provided they stay within MIT license
guidelines. If anyone using this project creates a graph they find useful,
they’re encouraged to submit a pull request to the lndmon project so others
can benefit from it as well. The plan is to evolve the exported metrics and
increase their usefulness over time.
The Future of lndmon
Finally, what does the future hold for lndmon? We want to greatly expand the
set of Prometheus metric collectors. lnd’s rich RPC interface provides reams
of data that is not currently aggregated. We also want to add alerts to
lndmon; e.g., a user might want to be notified when someone forwards a large
payment through one of their channels, or when someone opens a channel to them.
Another notable priority, as mentioned before, will be cultivating
community-sourced dashboards.
Here’s a list of the
metrics
currently available in lndmon.
Try lndmon Today!
lndmon is intended to be used by routing node operators and any users
interested in exploring information about their node and tracking this
information over time.
We believe lndmon will contribute to the stability and improvement rate of
Lightning by providing real-time feedback on events as they unfold in the
network. We encourage any Lightning developers, testers, routing node operators,
and technically-minded enthusiasts to
try lndmon today. Any feedback is
always very much appreciated – please feel free to submit issues to the
lndmon GitHub repo or get in contact with us via
Slack.